Course Overview
Knowing how to utilize data to predict future trends can be useful in business. This video training course is for employees to learn how to forecast data in Microsoft Excel 2016. This video teaches viewers how to use data tables to create a what-if analysis. Viewers learn how to work with multiple variables using data scenarios. Finally, the course demonstrates how to visibly display data trends. Use this video to educate employees about using Excel 2016’s data forecasting tools to create worksheets to help predict future trends.

Key Audience
All employees who use Excel 2016
Course Topics
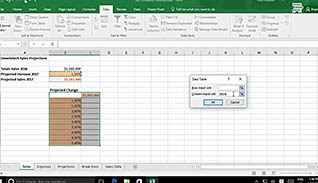
Determine Potential Outcomes Using Data Tables
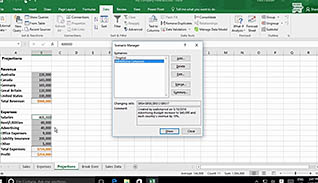
Determine Potential Outcomes Using Data Scenarios
Use the Goal Seek Feature
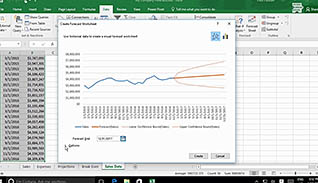
Forecast Data Trends
Course Detail
Course ID
sonie16fd_vod
Time
18-24 MIN
Questions
"6"
Languages
en
video format
HD
captions
Yes
Resources
Yes
Lessons
4
Remediation
Yes
Bookmarking
Yes
Feedback
Yes
Microlearning