Course Overview
PivotTables enable you to present business intelligence information quickly and easily, and PivotCharts help you take your data one step further. By presenting data graphically through PivotCharts, viewers can tell at a glance what your data signifies. Use this course to learn how to create PivotCharts, manipulate their data, and format them. PivotCharts allow you to seamlessly take sorted and analyzed information and display it in an easy-to-understand way. This allows you to present and showcase your information much more effectively. Utilize the information presented in this training video and learn how to employ another incredibly useful component of Excel: the PivotChart.

Key Audience
Excel 2016 users
Course Topics
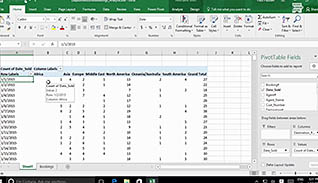
Create a PivotChart
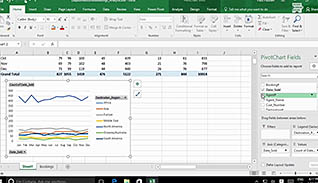
Manipulate PivotChart Data
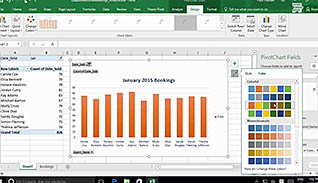
Format a PivotChart
Course Detail
Course ID
sonie16wp_vod
Time
14-18 MIN
Questions
"4"
Languages
en
video format
HD
captions
Yes
Resources
Yes
Lessons
3
Remediation
Yes
Bookmarking
Yes
Feedback
Yes
Microlearning